![]() Lunch Menu Calories tracking project
Lunch Menu Calories tracking project
It is important to know how many calories are in meals. Eating too many calories can lead to weight gain.
Eating too few calories can lead to unhealthy weight loss.
This project tracks the total calories of the lunch served at school for one week. Chart your findings.
How do you know the calories? - The person in charge of your cafeteria can provide that information. If not, use http://www.thecaloriecounter.com/.
As an alternative - do this project using a meal you eat at home. Always use the same meal: breakfast or lunch or dinner.
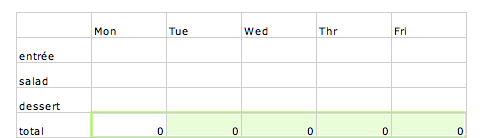
Step One - Make a Spreadsheet.
In columns B through F in row 1 - enter the days of the week. You may abbreviate Mon, Tues, Wed, Thr, Fri. Save
In columns A, rows 2 - 5 enter entree, salad, dessert, total.
Total - have the spreadsheet do the work
In cell B5 - use a formula to add up or find the SUM of the entree, salad and dessert for Monday.
1. Click in B5
2. Enter an = equal sign
3. Click in cell B2. (Mon entree)
4. Click in cell B3. (Mon salad)
5. Click in cell B4. (Mon dessert)
6. Tap the enter or return key.
A 0 (zero) should now appear in B5. The computer has checked each of the cells in the formula.
There are no amounts entered. The answer to the addition of them is 0 (zero).7. Save.
Fill - You could repeat this process for each column. But Fill does this easily.
1. Click in B5.
2. Drag to the right across the 5 row from Mon. through Fri.
3. In Excel - Go Edit .. Fill .. Right. Zip the computer has entered the correct formulas in each total cell.
(Other spreadsheet software also has a Fill. Look in the menus)4. Save.
Step Two - Chart your findings
1. Highlight all the labels and data in the spreadsheet.
2. Go Insert .. Chart or click on the Chart Wizard icon - in the tool bar at the top of the screen. (Look for the little bar chart)
3. Choose a chart that shows the data clearly.
4. Customize it.
5. Save
Step three - Consider your findings
1. Which meal had the highest amount of calories?
2. Which meal did you like the most?
3. Which meal did you like the least?
4. Which meal had the optimal calorie content?
5. Select a meal. Recommend changes that would improve its calorie content.
Other spreadsheet projects
Elbow Room - Exploring Population Density and Land use Issues
Test scores - how is your school doing compared to the state and region?
Bar chart using AppleWorks | Pie Charts in AppleWorks
12/2006 Cynthia J O'Hora All the material in this site is copyrighted
and may not be posted elsewhere or distributed in whole or in part.
Educators or individuals may print an activity, exactly as it appears, for use in a classroom setting. Use
of these materials is an agreement with these terms of use.